Cloud platform · Incident management
IncidentIQ — the incident record was a messy offline spreadsheet. I turned it into a cloud console teams respond from.
The problem: a nightly export of 1.2M rows across 22 columns, passed around on laptops and shared drives, was the only complete incident record — severity off-scale, the same outage open four times, SLA clocks running backwards, and “TBD” as an owner. So nobody could answer how bad it is, where it broke, or who has it.
The work: one cloud platform, two surfaces — a hosted ingestion pipeline that makes every incident feed inspectable in the browser, and a live, multi-tenant response console that turns every reconciled row into a scoped, deduplicated incident with one named owner, shareable by link from any device.
Where it started: one 22-column incident export
Before any hosted console existed, this offline sheet was the incident system of record — 1.2 million rows across 22 columns, emailed around, and nobody trusted a single one.
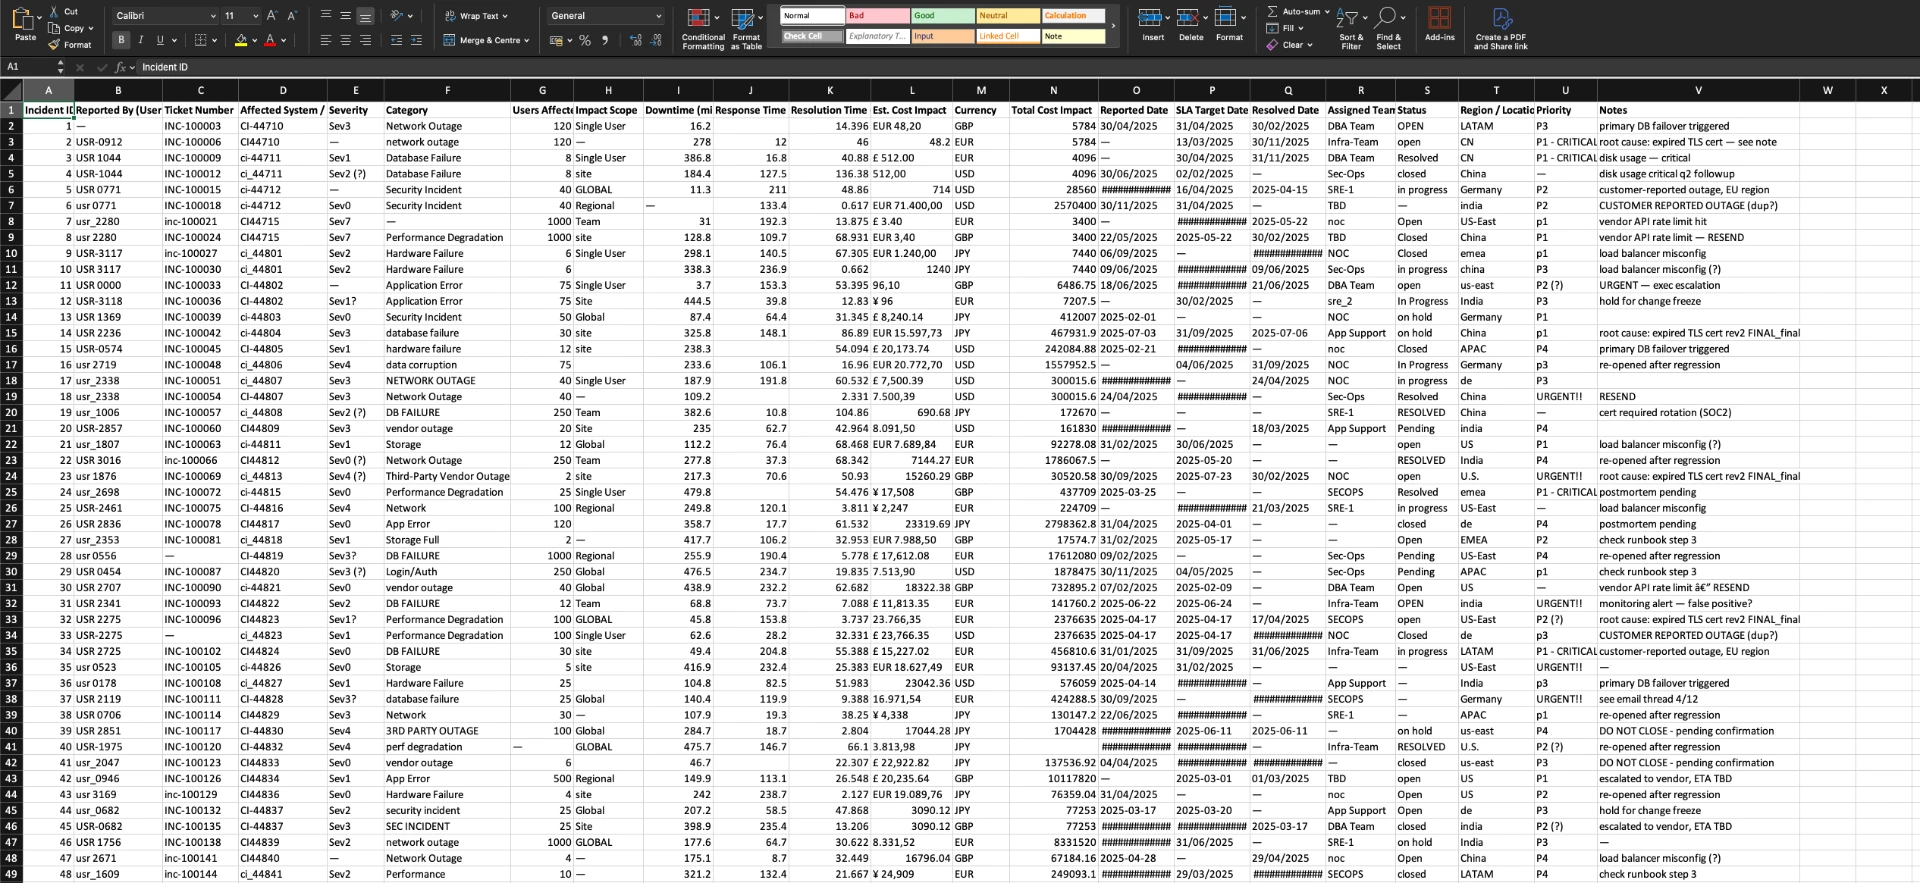
Eleven contextual interviews all opened the same way: someone shared their screen and scrolled through this. Incident IDs restart mid-file, the same outage appears under three ticket spellings (INC-100024, inc-100021, CI44715), severity holds values that are not on the scale, cost impact carries four currencies plus columns too narrow to render, and resolved dates land before the incident was reported. Status is free text — OPEN, open, in progress, closed — meaning different things on every desk. Every downstream number, from MTTR to SLA compliance, inherited these defects.
Duplicate incidents
One outage logged as INC-100024, inc-100021 and CI44715 — worked by three teams at once.
Off-scale severity
Sev7, “Sev2 (?)” and free text in a column that should only hold Sev0–Sev4.
Mixed currency impact
EUR, GBP, JPY and USD share the Cost Impact column, several cells too narrow to render.
Impossible SLA clocks
Resolved before reported, 30/02/2025 targets and blank timestamps beside valid ISO stamps.
Unowned incidents
Assigned Team reads “TBD”, a person’s first name, or nothing at all.
Missing values
Users affected, downtime, root cause and category blank on roughly one row in six.
The raw export, defect by defect
Filter ten representative incident rows by defect type. Every flag here was reconciled by hand, mid-incident, before the project.
Raw incident export — as received
10 rows · 36 data defects · 4 currencies · 6 date formats
| Incident | Ticket | Affected CI | Severity | Category | Cost impact | Reported | Resolved | Owner | Status | Defects |
|---|---|---|---|---|---|---|---|---|---|---|
| 1 | INC-100003 | CI-44710 | Sev3 | Network Outage | EUR 48,20 | 30/04/2025 | 30/02/2025 | DBA Team | OPEN | Impossible dateMixed currencyFree-text status |
| 2 | INC-100006 | CI44710 | network outage | network outage | 48.2 | 13/03/2025 | 30/11/2025 | Infra-Team | open | Duplicate incidentCasing / ID driftColumn shiftedCurrency missing |
| 3 | INC-100009 | CI-44711 | Sev1 | Database Failure | £ 512.00 | 30/04/2025 | 31/11/2025 | DBA Team | Resolved | Impossible dateMixed currencyPriority drift |
| 4 | INC-100012 | ci_44711 | Sev2 (?) | Database Failure | 512,00 | 30/06/2025 | missing | Sec-Ops | closed | Duplicate incidentSeverity out of scaleDecimal separator clashMissing value |
| 5 | INC-100015 | ci-44712 | Sev0 | Security Incident | ############ | 16/04/2025 | 2025-04-15 | SRE-1 | in progress | Unreadable cell (####)Mixed date formatFree-text status |
| 6 | INC-100018 | ci_44712 | Sev0 | Security Incident | USD 71,400.00 | 30/11/2025 | 31/04/2025 | TBD | missing | Duplicate incidentImpossible dateOwner is TBDMissing value |
| 7 | inc-100021 | CI44715 | Sev7 | missing | £ 3.40 | ############ | 2025-05-22 | noc | Open | Severity out of scaleMissing valueUnreadable cell (####)Casing / ID drift |
| 8 | INC-100024 | CI44715 | Sev7 | Performance Degradation | EUR 3,40 | 22/05/2025 | 30/02/2025 | TBD | Closed | Duplicate incidentImpossible dateOwner is TBDMixed currency |
| 9 | inc-100027 | ci_44801 | Sev2 | Hardware Failure | JPY 1.240,00 | 06/09/2025 | ############ | NOC | Closed | Mixed currencyDecimal separator clashUnreadable cell (####) |
| 10 | INC-100030 | ci_44801 | Sev2 | Hardware Failure | 1240 | 09/06/2025 | 09/06/2025 | Sec-Ops | in progress | Duplicate incidentCurrency missingFree-text statusResolved before reported |
On-call engineers reconciled this by hand during live incidents — roughly 40 minutes per major incident, and duplicate outages were worked twice by two different teams.
The problem
Two products, one root cause: incident data was unreadable, and the tools around it hid that fact.
Every desk had its own copy of the truth
A nightly export of 1.2M rows across 22 columns lived on laptops and shared drives. There was no hosted record — so the incident system of record was whichever file you happened to open.
Severity could not be trusted
Sev0 to Sev4 was the agreed scale, but the export contained Sev7, “Sev2 (?)”, “network outage” typed into the severity column, and P1 sitting beside P3 on the same incident.
The same outage was open four times
Duplicate reports of one failure were worked in parallel by DBA, Infra and Sec-Ops, because ticket IDs, CI names and casing never matched across tools — and no shared instance could see across them.
The SLA clock was fiction
Resolved dates preceded reported dates, 30/02/2025 appeared as a target, and cost impact arrived in four currencies plus ####-wide unreadable cells.
Nobody owned the incident
“TBD” was a common value in Assigned Team. Escalation was a chat thread, so unclaimed incidents aged quietly until a customer noticed.
The pipeline ran off-platform
Ingestion was a set of local scripts and notebooks on one engineer's machine. When it stalled, nobody else could see it — mean time to detect a parsing regression was over four hours.
Problem statement — as agreed at kickoff
Responders at Kestrel Digital Services cannot judge how severe an incident is, whether it is already being worked, or who owns it — because the only complete record is a 22-column nightly spreadsheet whose severities, dates and owners contradict each other.
Success = an engineer can go from page to a scoped, deduplicated, owned incident in under five minutes, with every uncertain field visibly quarantined rather than guessed.
“We can't tell how bad an incident is until it's over.”
Leadership framed the brief as reporting: the weekly incident review ran off a hand-cleaned spreadsheet that was already three days stale by the time anyone read it.
Who we designed for
Three personas across on-call engineering, incident management and service reliability.
On-call SRE
“I just need to know what broke, and how bad it is.”
- Real blast radius
- Trustworthy severity
- Duplicate detection
Incident Manager
“Is the SLA clock right, and who owns this?”
- One SLA clock
- Named owner
- Post-incident timeline
Reliability Lead
“Which systems keep failing, and what is it costing us?”
- Repeat offenders
- Cost of downtime
- Auditable evidence
“I don't need the tool to be clever. I need it to tell me what it couldn't read, so I know where to look.”
Goals
- Know severity and blast radius within a minute of paging
- See whether this outage is already open somewhere else
- Stop retyping incident details into three trackers
Pain points
- Severity strings like Sev7 and “Sev2 (?)” from the export
- Duplicate tickets worked by two teams at once
- Free-text status: OPEN, open, in progress, closed all coexist
Design needs
- Per-field confidence, not one global data score
- A visible quarantine queue instead of silent guesses
- One-click view of correlated reports and prior fixes
Tool usage
Tech comfort
High — reads the raw export before trusting a dashboard
What the research surfaced
Four findings that set the design constraints for both surfaces.
Responders rejected airy, marketing-style layouts. They wanted terminal density — more signal per pixel, monospace numerals, a predictable grid.
An incident can be mitigated for users and still open for root cause. A single OPEN/CLOSED word was not enough vocabulary.
Trust came from the system naming what it could not read. Defect chips on every row beat a silent, confident guess about severity.
Anything under 75% field confidence is quarantined for human review instead of being auto-routed or auto-closed.
From sheet to priced decision
Five hosted stages between an unreadable export and a scoped, owned incident. Each stage loses records — the design job was making that loss visible, recoverable, and observable by every team on the platform.
Ingest
Nightly exports, ITSM webhooks, monitoring alerts and team trackers stream into one hosted queue — no local scripts.
Normalise
Unify ticket and CI identifiers, map free-text severity onto a fixed Sev0–Sev4 scale.
Repair
Convert currencies, quarantine impossible dates, flag resolved-before-reported rows.
Correlate
Collapse duplicate reports of one outage into a single incident with a full trail.
Score & route
Attach impact score, SLA clock and one recommended owning team, published live to every tenant.
Stage 1 of 5
Ingest
Nightly exports, ITSM webhooks, monitoring alerts and on-call spreadsheets land in one queue.
100%
records still usable
The final output: two shipped cloud views
The same 22-column export, now readable in seconds in the browser — nothing to install, one shared live state. One view answers “how bad is it right now?”, the other answers “where exactly did this break?”.
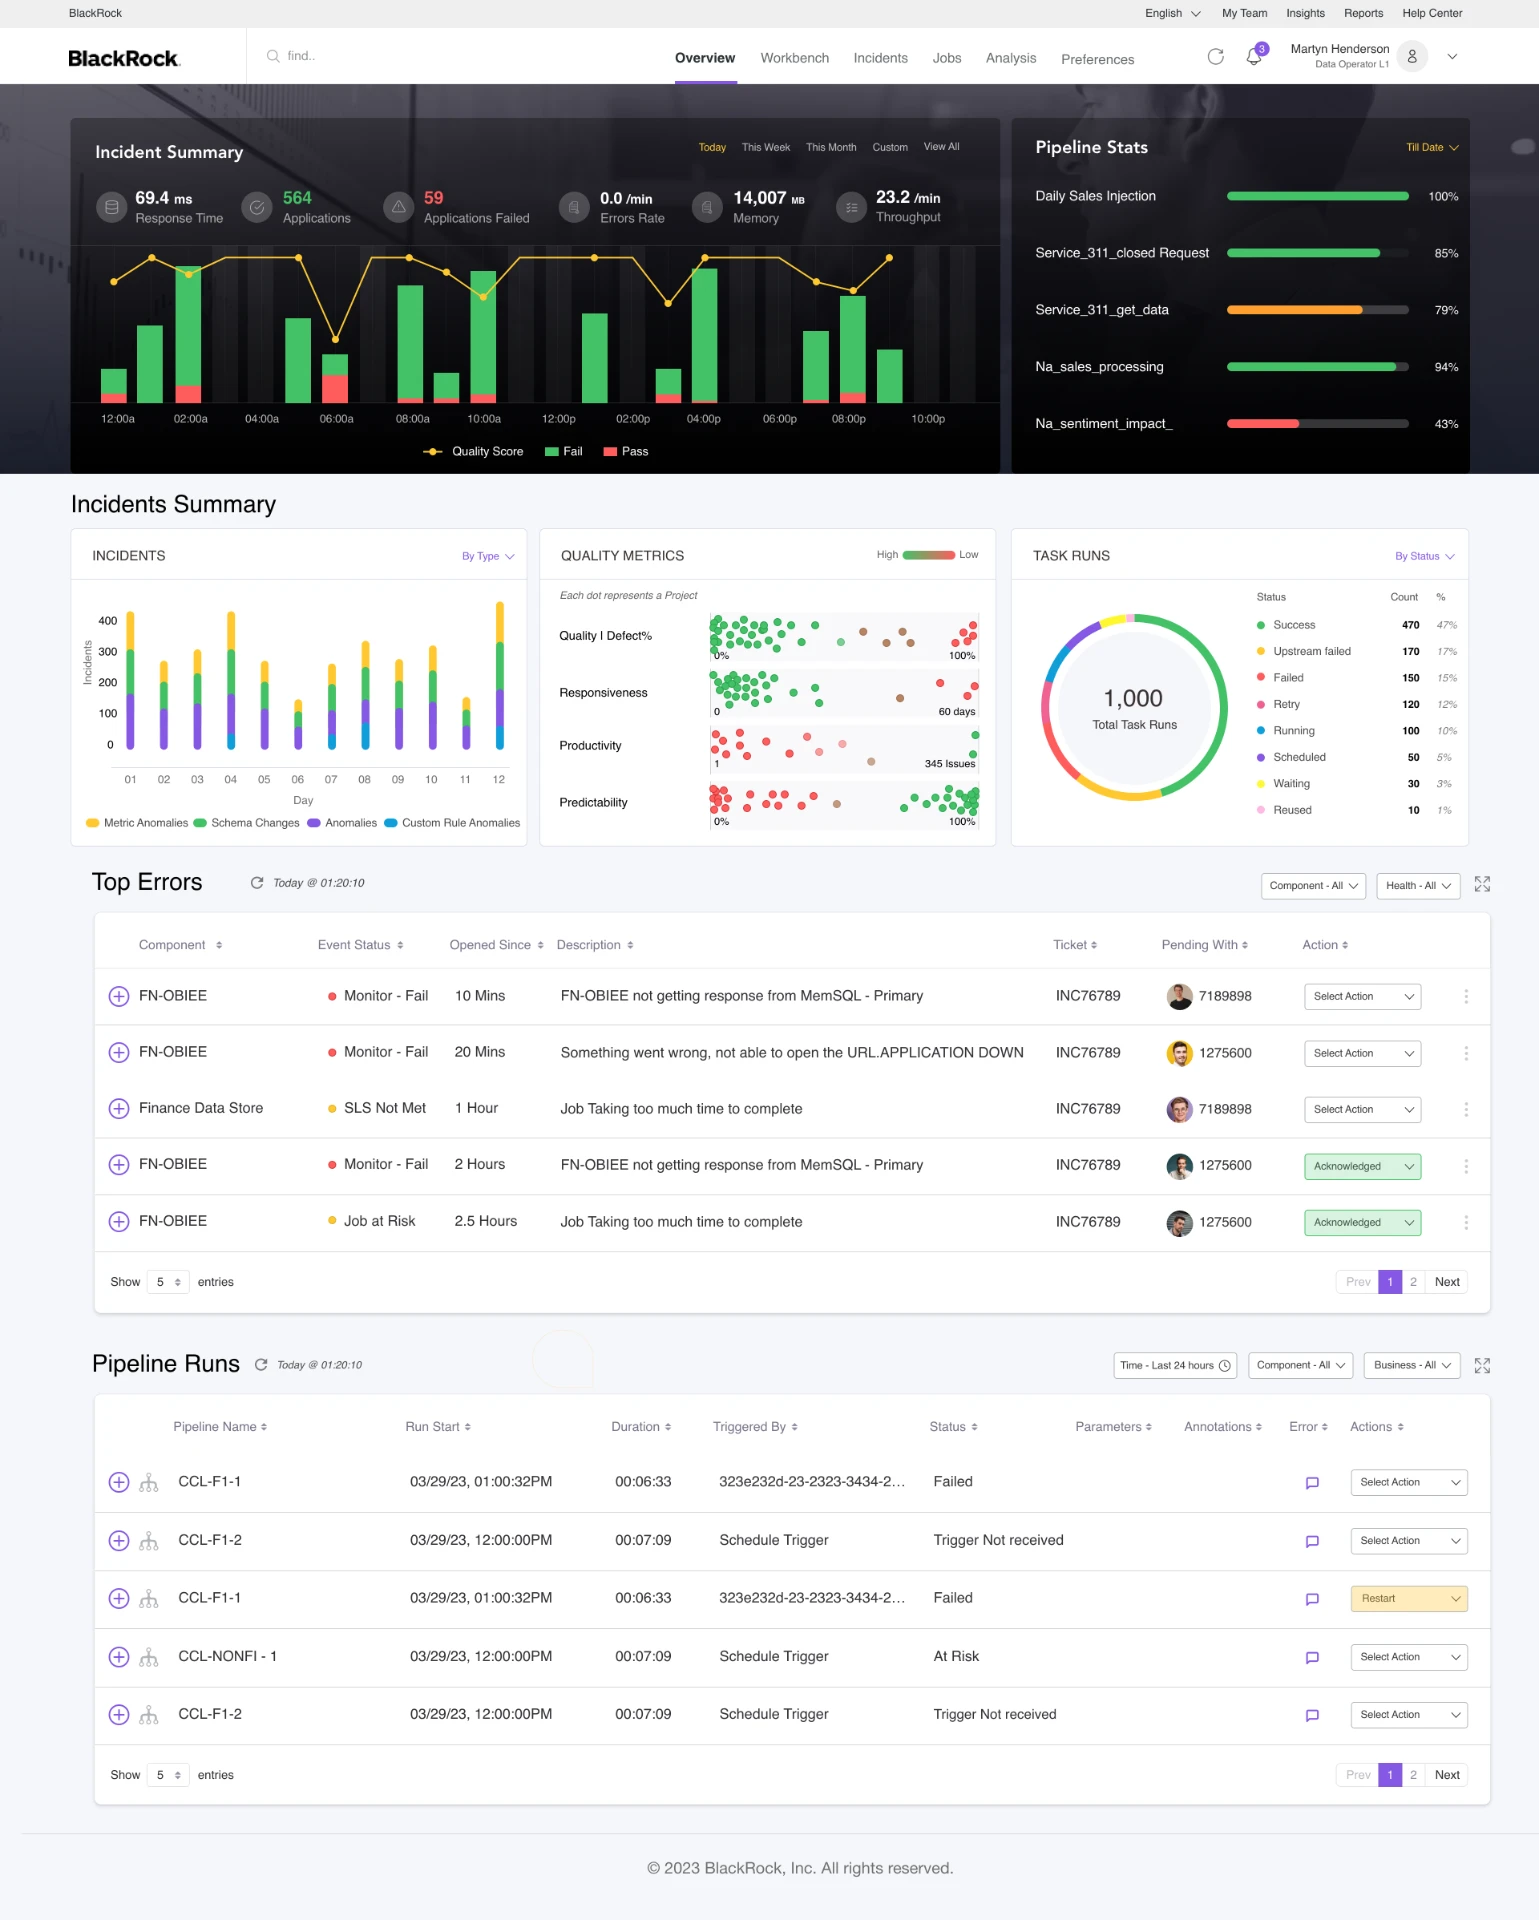
The console as responders actually see it at 1440px: one dark summary band for live health, ranked pipeline completion on the right, then four re-cuts of the same day and two working tables with inline actions — the whole triage loop above one scroll. Colour is reserved for state, and every aggregate drills back to the run and the row that caused it.
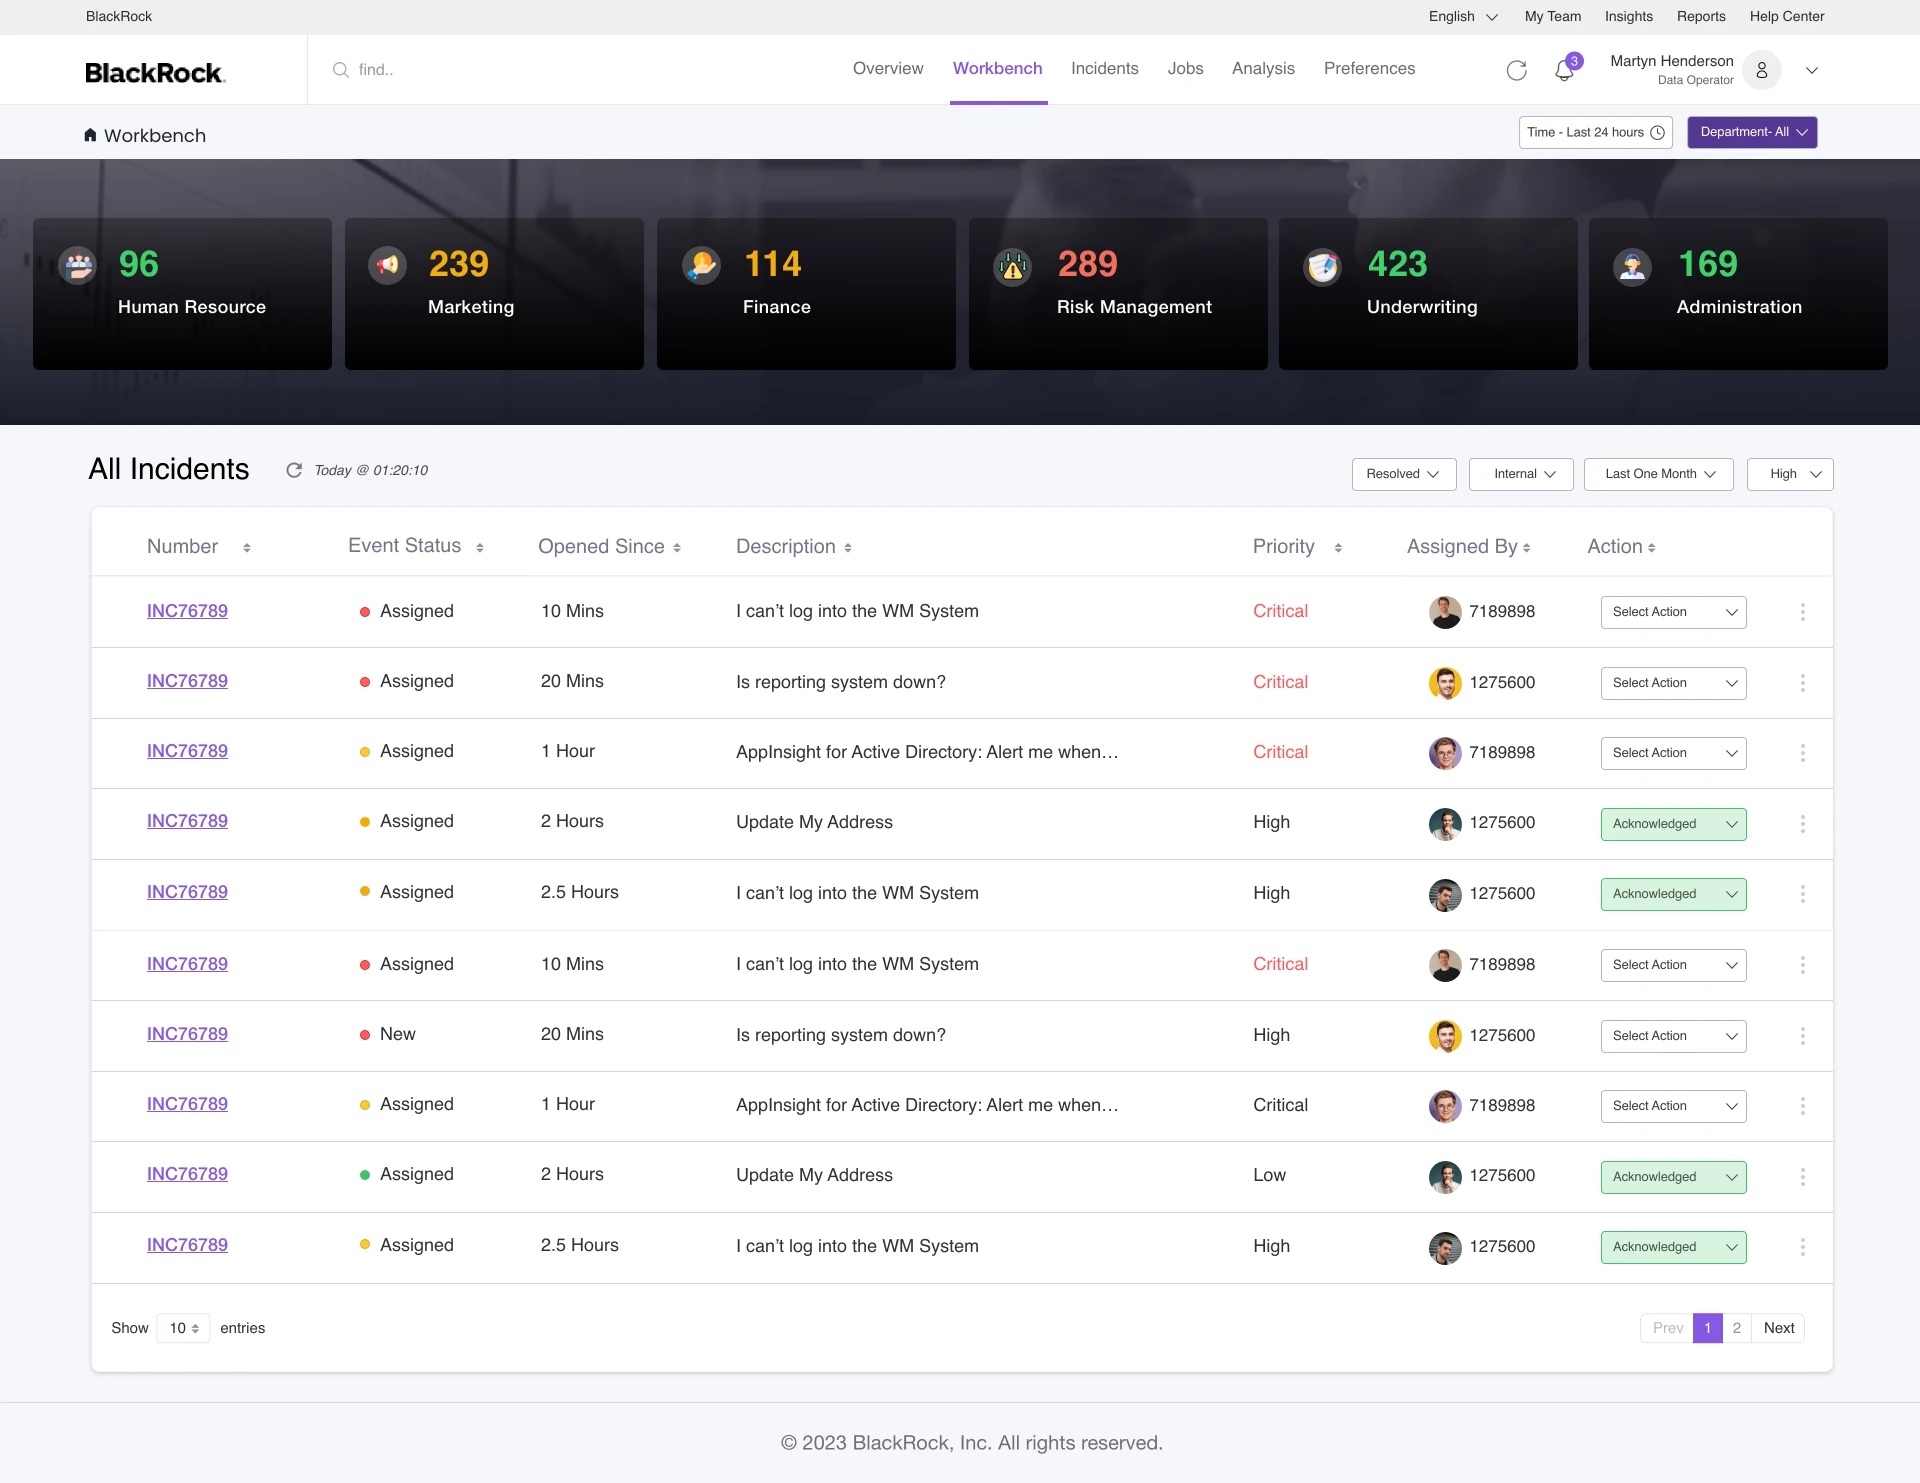
The queue view: department counters double as filters, and the reconciled table carries event status, age, priority and a named owner on every row — the four columns the raw export was least trustworthy about. Per-stage progress replaces the single “Failed” status the old tools returned, estimated vs actual timings expose SLA breaches inline, and ownership is a first-class column so nothing ages unclaimed.
The responder decision surface
The reconciled incident queue, per-record confidence, and one routing recommendation with the evidence beside it. Select an incident to inspect its candidate teams.
Incidents reconciled
6 / 10
from 10 messy export rows
Downtime cost avoided
€142,070
vs. current routing
Avg. field confidence
78%
quarantine queue below 75%
Time to scope
40m → 3m
page to owned incident
Incident queue
Primary database failover
INC-100003 · CI-44710 · Payments DB · LATAM
Routing recommendation
Assign to DBA Team (IN) — 2.1h historic MTTR, 4% reopen rate.
€24,940
Impact avoided (4.3h faster)
MTTR vs. reopen rate (all candidate teams)
Records surviving each pipeline stage
One screen, four altitudes
The console reads top to bottom, from headline to system internals — no navigation required to change altitude.
How the work was run
Fourteen weeks, double-diamond, with the as-is journey as the evidence base.
- 11 contextual interviews across two on-call rotations and the NOC
- Artefact audit: the 22-column nightly export, 3 ITSM views, 6 team trackers
- Shadowed 6 live incidents from page to post-incident review
Phase output
Evidence that the pain was trust and duplication, not reporting cadence.
As-is journey — on-call engineer, one major incident
Get paged
Reads a terse alert with no blast radius
Severity is unreliable
Find the record
Searches three trackers for the ticket
IDs never match across tools
Check duplicates
Asks in chat if anyone else is on it
Same outage open four times
Establish impact
Guesses users affected and cost
#### cells, four currencies
Find an owner
Escalates until a team accepts
Assigned team reads “TBD”
Close & report
Writes the timeline from memory
Dates contradict each other
Design decisions
The trade-offs made on purpose, and why.
Cloud-first, install nothing
Responders join a bridge from a laptop, a phone or a customer site. Everything ships as a hosted web console with a shareable deep link per incident — no VPN, no desktop client, no local copy of the export.
One timeline as the spine
Every chart on the console shares a 24-hour axis, so a latency spike and an incident spike can be correlated at a glance.
Live state over refresh
Incident rows, SLA clocks and ownership stream in over a persistent connection, so two responders on the same incident never argue about who has the newer file.
Rows over cards
Incident status changes many times a minute. A stable table preserves position; cards re-shuffle and disorient responders.
Tenant-scoped by default
The same console serves several service organisations, so every view, export and drill-down is scoped to the caller's tenant and role before it renders.
One owner, full evidence
Each incident resolves to a single recommended team with historic MTTR, reopen rate and correlated reports visible beside it.
Outcome
Measured after a twelve-week pilot across two buying desks and one on-call rotation.
−87%
Mean time to detect a regression
40m → 3m
Page to scoped, owned incident
76%
Records normalised end to end
0
Incidents left assigned to “TBD”
What I'd do differently
Three honest notes from the retro.
Alert fatigue is the next problem
The live feed scales linearly with monitored systems. Severity-weighted grouping and an explicit acknowledge loop come next.
Anomaly detection beats eyeballs
Responders still spot latency spikes visually. A baseline-plus-delta overlay would turn that into a glanceable signal.
Trusting users with density paid off
Every round of feedback asked for more data on screen, never less. The bet to keep it dense was the most validated decision.