← Selected Work06 · Oil & Gas · Enterprise

FieldSight 2.0 · 2017 · Apex Energy × TechSolve

From disconnected screens to a calm production cockpit.

A design-thinking led UX redefinition of Apex Energy's upstream production platform — turning slow, siloed, tribal workflows into a role-based, advisory-driven surface built to help Apex Energy capture 25% of the upstream market share by 2020.

Role

UX Lead — TechSolve

Client

Apex Energy

Scope

Discover → Design

Year

2017

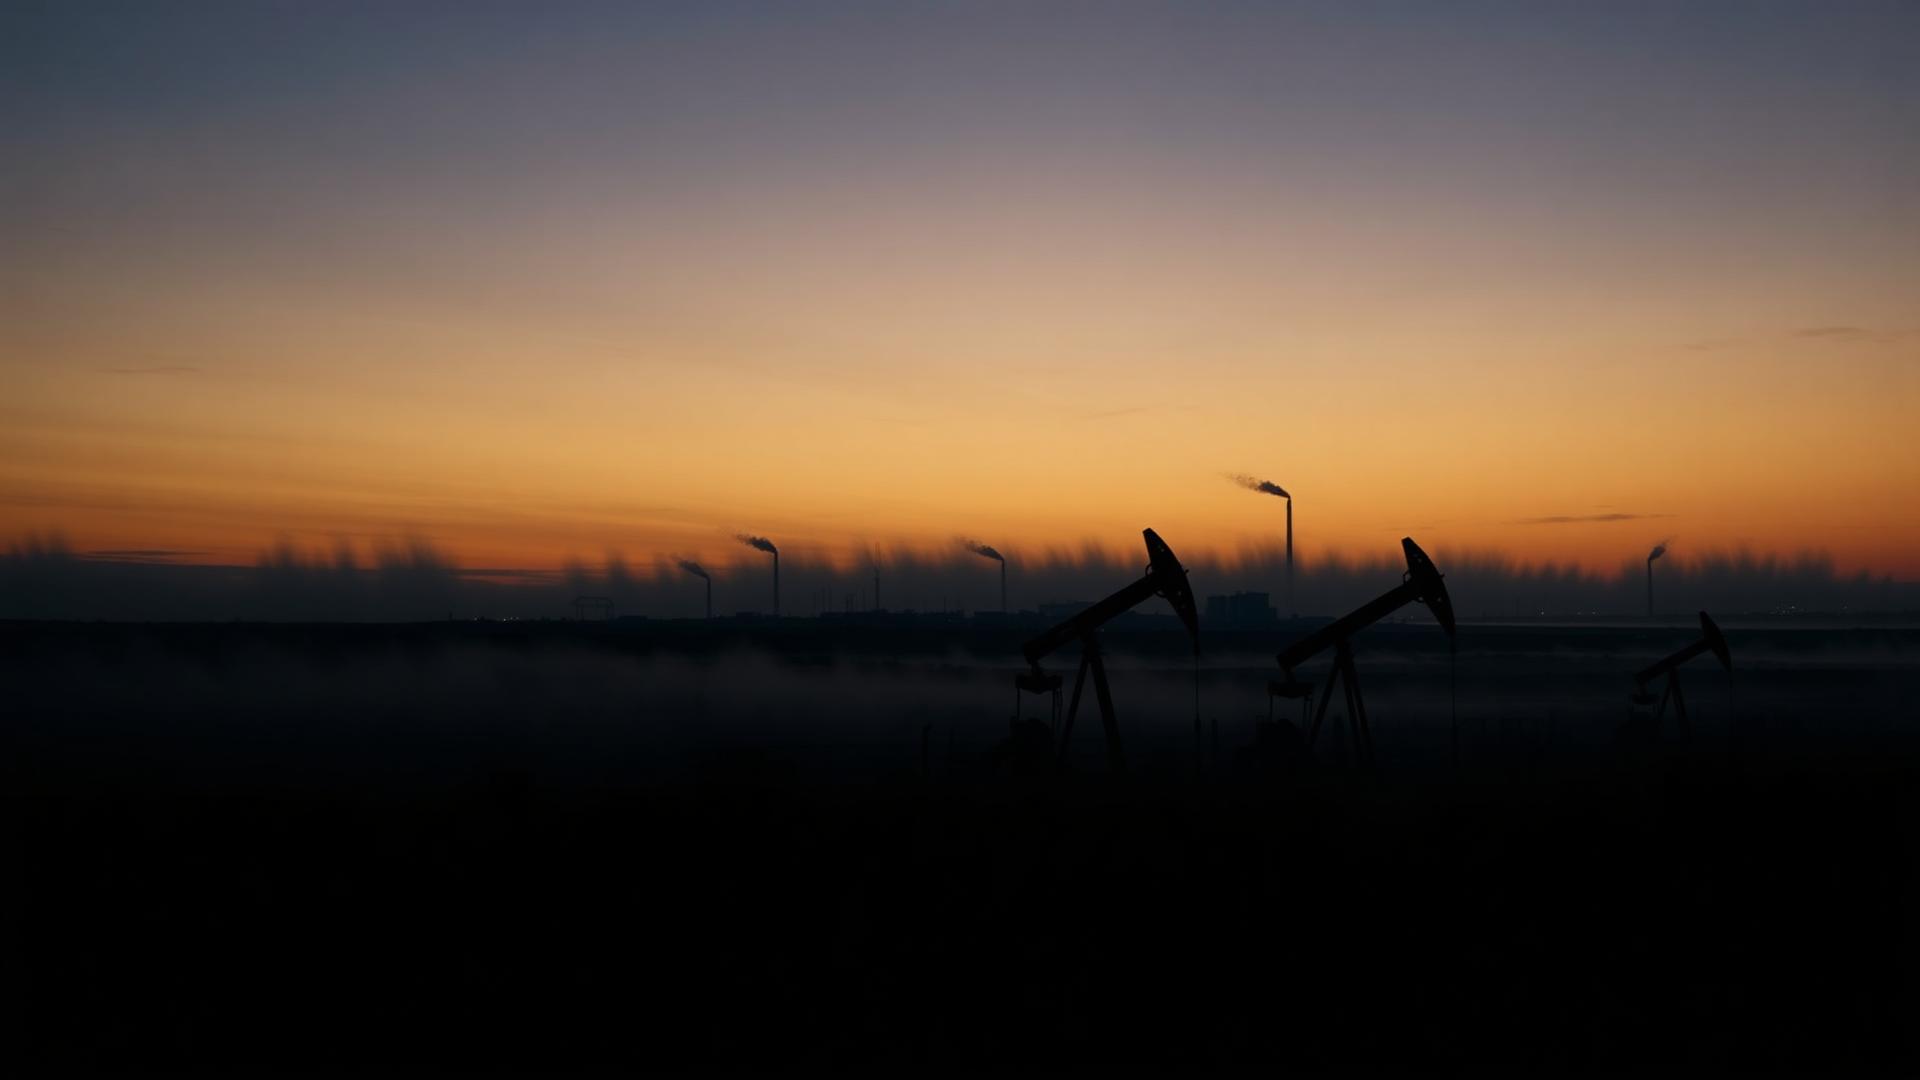
Oil and gas production field at dusk with pump jacks silhouetted against an amber sky

Problem

Production engineers juggled unreliable data, disconnected admin modules and non-scalable workflows — losing hours a day to context switching between charts, cases and spreadsheets.

Approach

A design-thinking led ‘Discover & Design’ engagement — 4 weeks of market research, 17 user interviews, 10+ focus groups, 6 journey maps, iterative wireframing.

Outcome

A modular, role-based FieldSight 2.0 concept — customisable dashboards, advisory-driven workflows, unified admin, faceted search and a shared collaboration fabric across five personas.

FieldSight is Apex Energy's production optimisation platform for upstream operators. The 2.0 redefinition — delivered in partnership with TechSolve — was not an application facelift. It was a redesign of the business model itself: the surface that would move Apex Energy from an equipment provider to a digital business solution provider, and open the path to a $1B / 25% upstream market share ambition by 2020.

The Vision

The final destination

01

Data-driven decisions

Empower customers to make informed decisions, faster — every screen answers ‘what should I do next?’ not just ‘what happened?’

02

Situational awareness

Real-time production well visibility — status, alerts, advisories and history collapsed into one place, not four.

03

Go faster, go smarter

Move Apex Energy from equipment provider to business-solution provider — the software becomes the differentiator, not the hardware.

Process

Two phases · one design-thinking spine

A structured Discover → Design cadence, grounded in User-Centred Design methods, made every downstream decision defensible.

Phase 01

Discover

Understand the landscape, the people and the pain — before drawing a single screen.

  • Market & competitor research (4 weeks)
  • 17 stakeholder & user interviews
  • 10+ focus group discussions
  • Usability tests · 3 sessions
  • Product demos & internal workshops
  • 6 journey maps across scenarios

Phase 02

Design

Translate discovery into a coherent, testable, scalable experience.

  • Task flows & sitemap
  • Iterative wireframing
  • Interaction models
  • 70 hi-fidelity screens
  • Well taxonomy & faceted search IA
  • 2 emerging-tech concept explorations

17

User interviews

10+

Focus groups

7

Personas

6

Journey maps

70

Hi-fi screens

~70h

Interview transcript

Problem Statements & How We Overcame Them

Six blockers.
Six breakthroughs.

The interview transcripts distilled into six recurring blockers — each one traceable to a design move in FieldSight 2.0.

01

Data shown by the system feels unreliable — engineers cross-check every chart before they trust it

How we overcame it: Every card carries provenance: source, timestamp, sensor and last sync. Dynacards, welllogs and reports share one lineage model so trust is built, not bolted on.

02

The product doesn't scale — new workflows and vendors need a release cycle to fit

How we overcame it: A modular card/widget architecture lets new workflows compose from existing primitives. Vendor-agnostic connectors sit behind the same UI shell.

03

Admin modules are disconnected — switching between them is painful and error-prone

How we overcame it: One unified Administration surface for sites, users, devices, roles and subsidiaries. One login, one session, one navigation model.

04

Global search is weak — users cannot reliably find files, cases, advisories or topics

How we overcame it: Customisable faceted search across wells, cases, tasks, files, advisories and topics — with saveable shortcuts for each role.

05

Workspaces are rigid — every persona is forced into the same layout

How we overcame it: Role-based, user-configurable dashboards. Add, remove and reorder cards. The layout learns from the user, not the other way around.

06

Collaboration lives outside the tool — decisions happen in email and team chat, not in FieldSight

How we overcame it: First-class conversations, notifications and shared artifacts on every case, well and advisory — no more parallel-universe email threads.

Who we designed for

Five personas, one shared surface

Roles overlap in the field. Titles blur under cost pressure and multi-tasking. The IA had to accommodate that ambiguity without forcing anyone into a wrong role.

Production Manager

Owns field production targets. Reviews dashboards from office and home. Rarely dives into individual well diagnostics.

Needs

  • · High-level well group overview
  • · Confidence in weekly targets
  • · Trigger & assign action plans

Production Engineer

Office-based bulk lifter. Dual-monitor setup. Handles wells, flowlines, artificial lift — monitors, diagnoses, prognoses.

Needs

  • · Case management & well logs
  • · My Vault for charts & reports
  • · Delegate tasks to field operators

Apex Energy DMO Engineer

Apex Energy-side counterpart to the production engineer. Brings equipment knowledge and cross-customer patterns.

Needs

  • · Advisory generation
  • · Diagnostic collaboration
  • · Escalation to helpdesk

Apex Energy Helpdesk

Software-issue owner. Needs collaboration tools — chat, screen sharing — to reproduce and resolve customer problems fast.

Needs

  • · Case management workflow
  • · Screen share & chat
  • · History & audit trail

Field Operator

Visits well sites daily. Laptop in truck or iPad. Gloves on. Intermittent connectivity. Needs data on demand.

Needs

  • · Offline-first mobile app
  • · Photo & artifact upload
  • · Simple task acknowledgement

Diagnostic Engineer

Deep well-behaviour expertise. Reads dynacards, well logs and charts to spot optimisation potential across the fleet.

Needs

  • · Advisory authoring
  • · Dynacard analytics
  • · Cross-well pattern search

Research findings

What 17 interviews surfaced

Pain-points that would otherwise stay buried under org charts and release notes. Every quote below re-scoped a feature.

Trust

“The data itself feels unreliable”

Engineers double-checked every chart against raw SCADA before believing it — a silent tax on every workflow.

Scale

“The product doesn't grow with us”

New workflows and vendors could not be accommodated without a release cycle. Scalability was a UX problem, not just an engineering one.

Speed

“It's just too slow”

Data communication latency and page loads broke concentration, especially during weekly production reviews.

Analytics

“Analytics needs a rethink”

Existing analytics didn't answer the actual questions engineers had — dynacards, welllogs and reports lived in silos.

Setup

“Setup is a big undertaking”

Onboarding a new customer or well took weeks. Admin modules were scattered and inconsistent.

Search

“Search can be improvised manifold times”

Global search barely returned results across cases, files, advisories and conversations. Faceted search was the single biggest ask.

Journey maps

Six scenarios, one narrative

The scenarios ranged from Monday-morning reviews to P1 emergencies. Each was mapped end-to-end with the personas, tools and touchpoints involved — and then compared to find the shared UX primitives.

01

Scenario

Weekly production target meeting

Production Manager, Engineer and Field Operator triangulate expected vs. actual STB/D across wells — dashboards, cases, tasks, mobile.

02

Scenario

Issue resolution

From diagnostic-engineer alert to field fix to helpdesk case — a five-step collaboration flow across every persona.

03

Scenario

Optimisation plan creation

A production engineer stitches My Vault, advisories, charts and knowledgebase into an executable plan.

04

Scenario

P1 advisory resolution

High-priority advisory triggers a collaboration or escalation path — every touchpoint traced and time-stamped.

05

Scenario

Diagnosis based on advisory

Diagnostic engineer works dynacards + welllogs to confirm root cause before creating tasks.

06

Scenario

Optimisation potential advisory

An advisory suggests a change; the plan is validated across manager, engineer and field before any well is touched.

Design tenets

The five principles behind every screen

Every wireframe, interaction and copy line was scored against these five tenets. If a screen failed any of them, it went back to the board.

01

Consistency

Same UI elements, same tone of voice, same interaction rules — everywhere.

02

Adaptability

Role-based, resolution-aware, offline-capable. The surface bends to the user, not the other way around.

03

Accessibility

Gloves-on field use, low-connectivity truck cabs, dashboards seen from across the room.

04

Discoverability

A connected system where information is available on demand — faceted search, global search, contextual links.

05

Focussed workflows

Let the user finish the task. Fewer modals, cleaner paths, task-oriented layouts.

Information architecture

Sitemap, taxonomy, search

The IA had three jobs: give every persona a home page, make the well hierarchy legible from field-level down to sensor-level, and turn a barely-functional global search into a faceted one.

  FieldSight 2.0
  ├── Dashboard          · role-based · customisable cards
  ├── Wells & Pads       · taxonomy: Field → Pad → Well → Component
  │   ├── Production cards
  │   ├── Charts / Dynacards / Welllogs
  │   └── Advisories
  ├── Cases              · case management workflow
  ├── Tasks              · assign · track · close
  ├── My Vault           · personal collation of charts, files, reports
  ├── Conversations      · threaded collaboration + notifications
  ├── Reports            · scheduled & on-demand
  ├── Knowledgebase      · specs, procedures, Apex Energy tribal knowledge
  ├── Faceted Search     · wells · cases · tasks · files · advisories · topics
  └── Administration     · unified across sites, users, devices, roles

Key features

Where FieldSight 2.0 became disruptive

Eight capabilities that, together, changed what production teams expected from a digital oilfield platform.

01Tenet · Adaptability

Customisable role-based dashboard

Each persona lands on a dashboard tuned to their role — Production Manager sees pad-level KPIs, Field Operator sees today's tasks and site logs. Users can add, remove and re-order cards to match their day.

02Tenet · Modularity

Modular card / widget based design

Every insight is a card. Production, advisory, chart, dynacard, welllog, task — all share the same skeleton, so learning one means learning all.

03Tenet · Focussed workflows

Workflow based journeys

Task-oriented flows (e.g. new site setup, well onboarding, P1 resolution) replaced menu-driven navigation. The system asks ‘what are you trying to do?’ before ‘which page?’

04Tenet · Focussed workflows

Collaboration among users

Conversations, notifications, mentions and artifact-sharing are first-class citizens — not bolted on. Every case, well and advisory can host a thread.

05Tenet · Traceability

Detailed log & history

Every action, artifact and decision leaves a timestamped trail — critical for audit, regulatory reporting and post-incident review.

06Tenet · Discoverability

Customisable faceted search

Global search returns wells, cases, tasks, files, advisories and topics — filterable by facet. Users save frequent searches as personal shortcuts.

07Tenet · Focussed workflows

My Vault

A personal space to collate charts, welllogs, dynacards, files and drafts — the raw material for reports, plans and cases.

08Tenet · Consistency

Unified, organised admin

No more multiple logins across admin modules. Sites, users, devices, roles and subsidiaries live in one Administration surface.
Looking ahead

Two emerging-tech concept probes

Beyond 2.0, we prototyped how voice and AR could extend the surface into the field — reducing gloves-off screen taps and making expert knowledge portable to any well site.

A

Conversational advisories

A voice-first assistant on the truck-cab tablet — ask ‘what's happening on Well 12?’ and get a spoken summary of advisories, tasks and last-known status.

B

AR-guided well inspection

Overlay live SCADA data and step-by-step procedures on the physical well through a hands-free AR headset — expert diagnostics in the field, without the expert on-site.

Outcomes

What the redefinition delivered

70

Hi-fi screens shipped

6

Journey maps validated

7

Personas aligned

1

Source of truth handbook

The redefinition became the single source of truth for Apex Energy, TechSolve, developers, BAs and stakeholders — a shared handbook aligning every downstream decision to the vision of a data-driven, situationally aware, faster and smarter FieldSight.